|
Reservoir Characterization
Reservoir characterization is like a mystery solved by expert detective work and the latest technology. Our agents, geoscientists and engineers, piece together geologic clues and fluid properties to gain an accurate picture of what an oil or gas reservoir looks like.
Geologic information plays a particularly vital role in all of this because geology determines how fluids accumulate in and pass through a reservoir. Especially significant are stratigraphic, diagenetic, and structural investigations. These kinds of inquires allow geologists to actually piece together the rock distributions and connectivity. Getting the picture right is not that simple, though, and requires an integration of core, seismic, wireline log, borehole image, and dynamic reservoir data.
|
|
Intensely fractured core
|
Summary diagram showing the stratigraphic distribution of fractures and no-recovery intervals in core. Fracture classification is as follows: without letter = mineralized fracture, S= mineralized fracture set, H= single hairline fracture, Hs = set of hairline fractures.
|
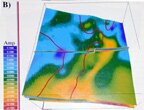
3-D seismic time slice delineation of major fracture systems and faults
|

Stratigraphic core study
|
Cycle analysis: Repetitive lithofacies define a upward-shoaling cycle stack
|
Sequence stratigraphic cross section provides framework for rock fabric distributions.
|
|

Petrohraphy reveals fabric destructive dolomite replacement in this thin section photomicrograph.
|
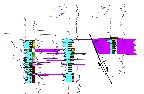
Correlation of closely-spaced wells shows dolomite (purple) distribution is laterally discontinuous and that faults have major dolomite replacement associated with them.
|
Interparticle porosity-permeability crossplot for rock fabrics 4 and 5 plot up is distinct fields.. Separate vug porosity averages 6.5 % for RF 4 and <1% for RF 5.
|
Cross section showing rock fabric relationships. This section provides the framework tor porosity and permeability distributions.
|
Synthetic 3-D shows spatial disrtibution of synthetic amplitude.
|
|